Maximo Linear Asset Manager
Manage linear assets is used for managing assets such, pipelines, cables, roads
Maximo Calibration
- Speed and refine instrument calibration to drive exceptional asset performance.
- Automate calibration processes across your enterprise to help increase effectiveness and minimize operating costs
- Leverage full traceability and reverse traceability to ease compliance with industry regulations
- Enable technicians to perform mobile calibration using handheld computers to streamline work tasks
- Enhance accuracy and reporting of instrument calibration to help address regulatory compliance


Using WO application, the technician can realize field inspections, with task and collecting meters points for condition monitoring. A very powerful tool for reliability engineer to observe all the machine operation conditions. The Inspections are stored at Asset level, and the user has access to this history record.
Maximo Spatial Asset Management
Maximo has out of the box data and UI integration to GIS, including a highly unique capability to handle linear asset, work, incident, etc.. records fully integrated with the GIS.
Provides a GIS solution that allows users to ‘visualize, question, analyze, and interpret data to
understand relationships, patterns, and trends.’
- Allows users to look at data in a way that is quickly understood and easily shared on a map.
- Creates a level of awareness and insight that tabular systems without graphics cannot provide.


Business value
- Decrease equipment failure
- Reduce operation cost
- Increase asset availability
- Extend asset life time;
- Increase production output
Maximo Scheduler and Scheduler Plus
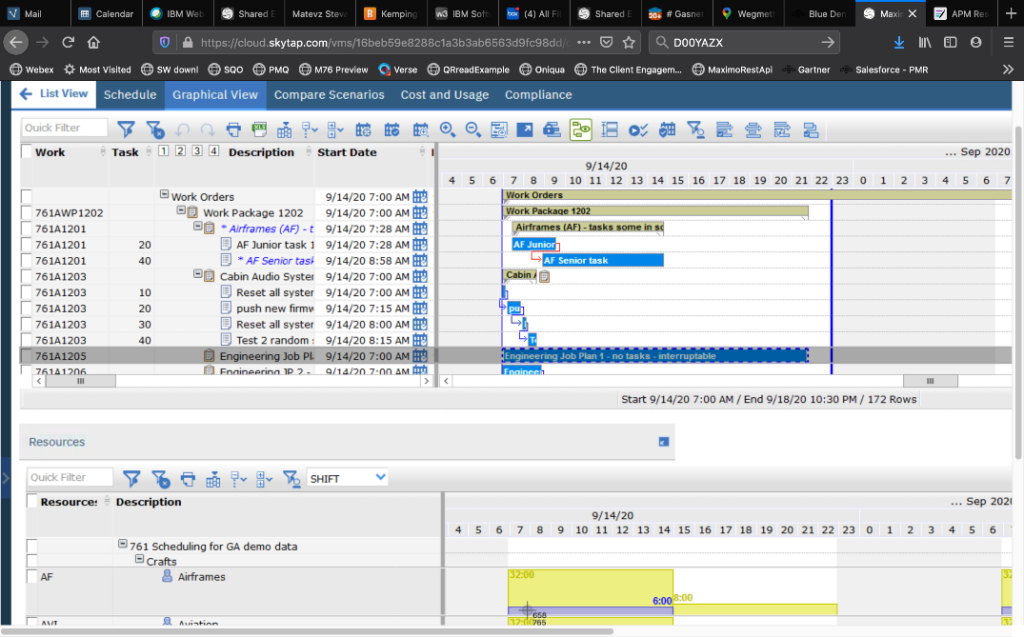
IBM Maximo supports Long- and mid-term planning with a drag and drop GANTT scheduling tool.
The Long- and mid-term planning calculates with resource types as planning with exact employee is not important in this phase
Planning with resource type level can show the planner if enough resources are available for a given period of time and also normalized costs can be calculated based on hourly prices of different skill level personnel. The GANTT chart dynamically shows the number of employees for a given time period with color coding (bottom right of the screenshot below). One can plan for different work shifts as well. Tasks constraints and relationships (finish-to start, etc..) are also taken into consideration
